pyepr.GaussianPulse
- class pyepr.GaussianPulse(*, tp=32, FWHM=None, freq=0, **kwargs)
Bases:
PulseRepresents a Gaussian monochromatic pulse.
By default, the FWHM is set to tp/(2*np.sqrt(2*np.log(2))).
- Parameters:
- tpfloat
Pulse length in ns, by default 32
- FWHMfloat,
The full width at half maximum of the pulse. Defaults to tp/(2*np.sqrt(2*np.log(2))).
- freqfloat, optional
The frequency of the pulse, by default 0
Examples
import pyepr as epr
import matplotlib.pyplot as plt

GuassPulse = epr.GaussianPulse(tp=32)
GuassPulse.plot(pad=0)
plt.annotate('', xy=(-GuassPulse.FWHM.value/2, 0.5), xytext=(GuassPulse.FWHM.value/2, 0.5), color='C1',arrowprops=dict(arrowstyle='<|-|>', color='C1',lw=2))
plt.annotate('FWHM', xy=(0, 0.51), xytext=(0, 0.51), color='C1', ha='center', fontsize=12)
(
Source code,png)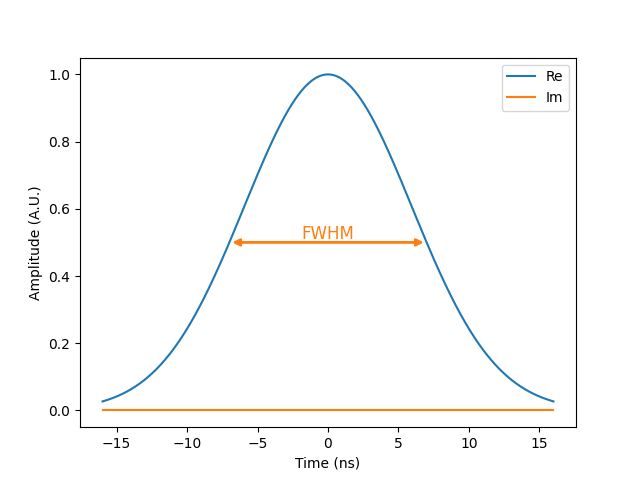
- freq
- FWHM
- func(ax)
- plot(pad=1000)
Plots the time domain representation of this pulse.
- Parameters:
- padint, optional
The number of zeros to pad the data with, by default 1000