Note
Go to the end to download the full example code.
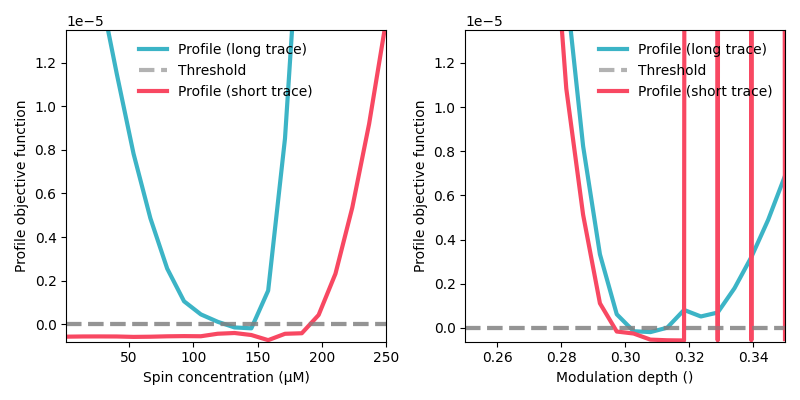
Identifiability analysis of a 4-pulse DEER signal via the profile analysis method
How to use the profile analysis method to asses whether the 4-pulse DEER model parameters are identifiable (unique) for a given experimental signal.
import numpy as np
import matplotlib.pyplot as plt
import deerlab as dl
from deerlab.constants import D
green = '#3cb4c6'
red = '#f84862'
# File location
path = '../data/'
file = 'example_4pdeer_1.DTA'

# Experimental parameters
tau1 = 0.3      # First inter-pulse delay, μs
tau2 = 4.0      # Second inter-pulse delay, μs
tmin = 0.1      # Start time, μs

# Load the experimental data
t,Vexp = dl.deerload(path + file)

# Pre-processing
Vexp = dl.correctphase(Vexp) # Phase correction
Vexp = Vexp/np.max(Vexp)     # Rescaling (aesthetic)
t = t - t[0]                 # Account for zerotime
t = t + tmin

# Truncate the signal
Vexp_truncated = Vexp[t<=2]
t_truncated = t[t<=2]

# Distance vector
r = np.arange(2,7,0.05) # nm

# Construct the model
Vmodel = dl.dipolarmodel(t,r, experiment=dl.ex_4pdeer(tau1,tau2, pathways=[1]))
Vmodel_truncated = dl.dipolarmodel(t_truncated,r)

# Compute uncertainty with the likelihood profile method for the spin concentration and modulation depth parameters
grids = {
    'conc': np.linspace(1,250,20),
    'mod': np.linspace(0.25,0.35,20),
}

profile_long = dl.profile_analysis(Vmodel,Vexp, parameters=['conc','mod'], grids=grids)
profile_short = dl.profile_analysis(Vmodel_truncated,Vexp_truncated, parameters=['conc','mod'], grids=grids)
plt.figure(figsize=[8,4])
for n,param in enumerate(['conc','mod']):
    plt.subplot(1,2,n+1)
    for profile_uq,color in zip([profile_long,profile_short],[green,red]):
        profile = profile_uq[param].profile
        threshold = profile_uq[param].threshold(0.95)
        plt.plot(profile['x'],profile['y']-threshold,'-',color=color, linewidth=3)
        plt.hlines(0,min(profile['x']),max(profile['x']), linewidth=3, linestyles='--',color='grey',alpha=0.6)
    plt.autoscale(True,'both',tight=True)
    plt.ylim([1.1*(np.min(profile['y'])-threshold),1.5*threshold])
    plt.xlabel(f'{getattr(Vmodel,param).description} ({getattr(Vmodel,param).unit})')
    plt.ylabel('Profile objective function')
    plt.legend(['Profile (long trace)','Threshold','Profile (short trace)'],frameon=False,loc='best')

plt.tight_layout()
plt.show()
Total running time of the script: (17 minutes 20.571 seconds)